
4.5 Describe the use of syslog features including facilities and levels
When we’re logged in to a switch or a router via console, we can see different logging messages appearing. By default, “logging console” is enabled.
If we find the messages annoying, we can turn them off in our session by typing no logging console. This is only valid for the session that we are in.
A user logged in to a switch or router via Telnet or SSH will not see the logging messages unless we do two things
- Activate the logging through the global logging monitor command
- Each user must activate the logging in his individual Telnet or SSH session by typing the terminal monitor command after he logs in.
After a logging message is sent to the user, it is gone forever. If nobody was logged in to the switch or router when the message was generated, it is also gone forever.
We can store the messages in the RAM by typing logging buffered in the global configuration. If we come back later and want to check the messages, we type show logging.
We can also tell the device to send the messages to a central server. A central server for logging messages from network devices is called a syslog server. We do this by typing logging host <syslog server IP address or hostname> in the global configuration.
Each IOS log message has looks like this
*May 2 18:30:15.113: %LINEPROTO-1-UPDOWN: Line protocol on Interface GigabitEthernet0/0/1, changed state to up
This message tells us the following
- The timestamp: May 2 18:30:15.113
- The router program that created the message: %LINEPROTO
- The severity of the message: in this case it is 1
- The name of the message: UPDOWN
- A human readable description of the message: Line protocol on Interface GigabitEthernet0/0/1, changed state to up
Some things we can do
- We can disable the time stamp by typing no service timestamps.
- We can give each message a sequence number so that it can be referenced later, by typing service sequence-numbers.
The message severity is from 0 to 7 as shown in the following table
| Message Number | Severity |
| 0 | Emergency |
| 1 | Alert |
| 2 | Critical |
| 3 | Error |
| 4 | Warning |
| 5 | Notification |
| 6 | Informational |
| 7 | Debug |
We should deal with any message with a severity of 0 or 1 immediately. A message that has a severity of 2, 3, or 4 should be dealt with as soon as possible.
We might want to ignore messages that are of a low severity. We can do that by typing a number or severity after the logging command. The switch will stop logging or sending messages above the designated severity level. The commands are
- logging console <number or severity>
- logging monitor <number or severity>
- logging buffered <number or severity>
- logging trap <number or severity>. This is an exception for the logging host command.
For example, if we don’t want to view messages below the Warning level in our console, we can type logging console warning or logging console 4.
We can verify the logging by typing show logging.
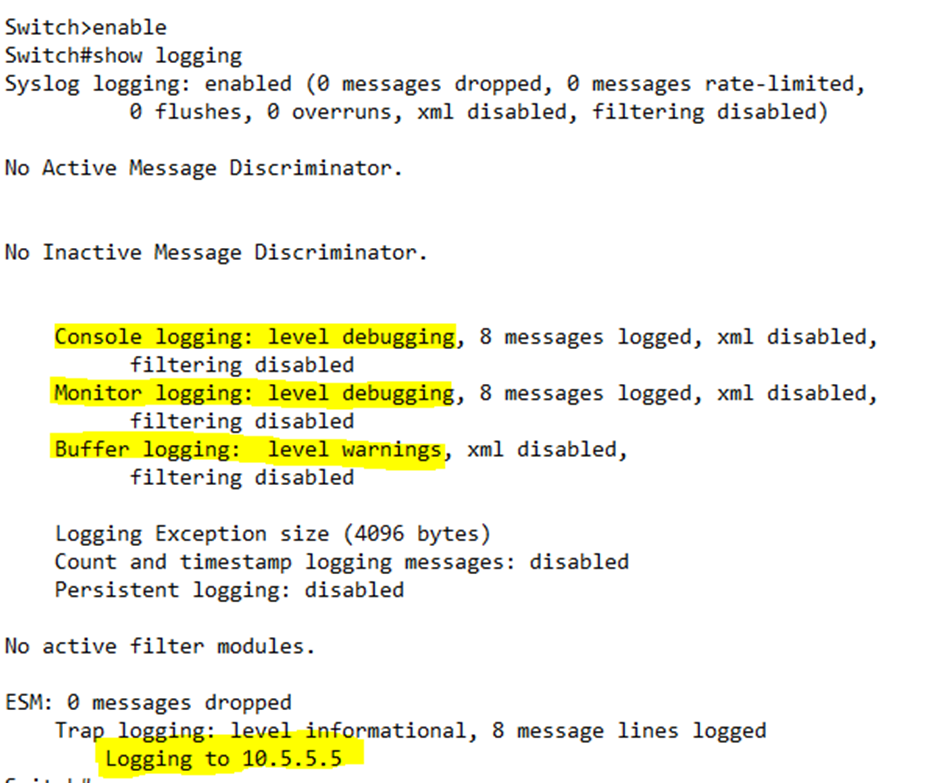
We can see the Console logging, Monitor logging, Buffer logging, and Trap (syslog) Logging levels. We can also see the IP address of the syslog server.
The switch or router will list each logging level by name not by number.
We can erase any logs by typing clear logging.
The router will not show any messages of a debug severity unless we log in and type debug. The debug command stays active until we type no debug. We turn on debug to monitor activities in the router. For example, I can turn on ICMP debugging by typing debug ip icmp. If I want to turn it off, I must type no debug ip icmp.
The generation of debug messages consumes a substantial amount of router resources and should only be enabled when necessary. That is why it is disabled by default.