
3.1 Given a scenario, use appropriate statistics and sensors to ensure network availability
- Performance Metrics/Sensors
- Device Chassis
- Temperature
- Central Processing Unit (CPU) Usage
- Memory
- Network Metrics
- Bandwidth
- Latency
- Jitter
- Device Chassis
- SNMP
- Traps
- Object Identifiers (OIDs)
- Management Information Bases (MIBs)
- Network Device Logs
- Log Reviews
- Traffic Logs
- Audit Logs
- Syslog
- Logging Levels/Severity Levels
- Log Reviews
- Interface Statistics/Status
- Link State (Up/Down)
- Speed/Duplex
- Send/Receive Traffic
- Cyclic Redundancy Checks (CRCs)
- Protocol Packet and Byte Counts
- Interface Errors or Alerts
- CRC Errors
- Giants
- Runts
- Encapsulation Errors
- Environmental Factors and Sensors
- Temperature
- Humidity
- Electrical
- Flooding
- Baselines
- NetFlow Data
- Uptime/Downtime
If the network is unavailable or the performance is poor, the business will not be able to function? How can we properly monitor the network so that we can detect issues and resolve them before they get out of control? We should not wait until a user complains.
At the hardware level, we can monitor three things
- Temperature – if the device (router, switch, server, etc.) is operating at a higher temperature than is normal, it might be overloaded, or it may have a hardware problem (a fan is not functioning) or the room that it is in may not be cooled properly. In general, devices should operate at a temperature of less than 90 F, but we should check the manufacturer’s specifications for each device.
When we see that a network device has a higher than normal temperature, we should check the CPU usage. If the CPU usage is not high, then the device may have issues with cooling or may need to be replaced. It is also possible that it has a faulty thermometer. A device that overheats may automatically shut down (if equipped with that feature) or may just fail. - CPU Usage – when a device has a high CPU usage, it means that
- It is receiving more traffic than it was designed to handle. We should verify whether the traffic is legitimate. If it is, then we should upgrade the device or replace it with a more powerful model. If the traffic is not legitimate, then it is possible that the device is under attack. We should find the source of the increased traffic and block it.
- There is a software bug that is causing the device to overload. We should upgrade or downgrade the device software, firmware, or configuration to reduce the CPU load. For example, an administrator may have written a new configuration that causes the device to make calculations in an endless loop, which could explain the high CPU usage.
- It is receiving more traffic than it was designed to handle. We should verify whether the traffic is legitimate. If it is, then we should upgrade the device or replace it with a more powerful model. If the traffic is not legitimate, then it is possible that the device is under attack. We should find the source of the increased traffic and block it.
- Memory – when a device has a high memory usage, it means that
- It is receiving more traffic than it was designed to handle. It is possible that the device is receiving traffic but is not able to send it out fast enough. Thus, it is storing the traffic in a buffer. The device is either receiving more traffic than was expected or the devices downstream are not able to accept the traffic. We should upgrade the devices as necessary.
- There is a software bug that is causing the device to occupy too much memory. We should upgrade or downgrade the device software, firmware, or configuration to reduce the memory load. We can also try rebooting the device to clear the memory and see if the issue returns.
- It is receiving more traffic than it was designed to handle. It is possible that the device is receiving traffic but is not able to send it out fast enough. Thus, it is storing the traffic in a buffer. The device is either receiving more traffic than was expected or the devices downstream are not able to accept the traffic. We should upgrade the devices as necessary.
At the network level, we can monitor three things
- Bandwidth – Bandwidth is the maximum data transfer rate on a connection. It is also known as throughput, or Goodput. Goodput is the useable bandwidth (actual bandwidth minus overhead for protocols). It’s like the weight of the mail without the envelopes.
Bandwidth is like how wide a highway is. If I was monitoring the highway between New York and Florida, bandwidth would be the number of lanes. The more lanes there are, the more vehicles that can get through per second.
If we are playing a video, the greater the bandwidth, the higher the quality of video we can broadcast. - Latency – Latency is how long it takes to get a packet from the source to the destination. When we are sending a stream of packets, and bandwidth is good, our main concern is how long it takes for the first packet to arrive.
If we are playing a video, the latency is the time it takes for the video to start playing after we press play.
Going back to the highway, the distance is kind of like the latency. If a group of bikers started their trip in New York, how long it takes for them to reach the destination is the latency.
Latency is based on distance and it’s also based on how many twists and turns the data must take. If the data can take a direct route to the destination, the latency will be lower than if it has to stop through other networks and routers.
If we’re experiencing high latency, we can run a tracert to see where the data is passes through. On a residential network, there isn’t much we can do, but on a commercial network, we can negotiate a better plan (like a WAN or MPLS) with our ISP so that they can prioritize our traffic. Areas with high latency might be called bottlenecks. - Jitter – Does the data we send show up in the same order, or is it all mixed up? If some cars started the trip in New York, do they show up in the same order in Florida or a different order?
If we are playing a video, a high jitter would make the video frames show up in an incorrect order.
At the interface level, we can look at several items. We can check these on a router, switch, or client device (laptop, desktop, wireless access point, server, etc.) Chances are, if a device is experiencing connectivity issues, we are going to check at the router or switch first – the client device will be offline, but we will probably still be able to access the switch.
- Link State (Up/Down) – is the physical connection up or down? If the link is up (i.e. there is traffic) then we can look at other areas to troubleshoot. If the link is down, then that means at least one device is not communicating. Possible causes
- The port has been disabled on the switch/router or client device
- The client device is powered off
- The cable between the two devices is damaged
- The port has been disabled on the switch/router or client device
- Speed/Duplex – is the speed and duplex setting on each device correct? If the speed or duplex is mismatched, then the devices will not be able to communicate.
- Send/Receive Traffic – how much traffic is being sent and how much traffic is being received? If we are not receiving any traffic, but sending lots, then the other device may not be configured correctly. For example, if our router interface has the wrong IP address, it may be sending traffic to the wrong destination, which would explain why it is not receiving any in return.
- Cyclic Redundancy Checks (CRCs) – each time a packet is received, the device performs a check to verify that it was received correctly. If a high number of packets fail the check, then we know that there is a transmission error.
- Protocol Packet and Byte Counts – this tells us how many packets have been sent/received and the total number of bytes being sent/received.
- Giants – a giant is a frame that is larger than the maximum permitted size of 1500 bytes.
- Runts – a runt is a frame that is smaller than the maximum permitted size of 64 bytes. Giants and runts are caused by
- Malfunctioning network interface cards
- Electrical interference on the cable
- Collisions on the cable (only common on half-duplex)
- Malfunctioning network interface cards
- Encapsulation Errors – a router interface may be misconfigured
Networks generate a lot of information to collect and monitor. SNMP or Simple Network Management Protocol is the standard for collecting data from network devices and for updating their configuration.
- An SNMP Monitor is a tool that automates this data collection and configuration.
- Each device that is subject to monitoring contains software called an Agent. The Agent sends data back to the monitor. The Agent might be pre-installed by the manufacturer or it might be something that an administrator must install manually. A device can be read only (can only be monitored) or read-write (can be monitored and configuration can be changed).
- The types of data collected are known as variables. SNMP does not determine the variables. Rather, each device can set the variables that it wishes to share.
- A manager must typically request the data from the agent.
- If a significant event occurs, the device can send unsolicited data to the agent. This type of data is known as a trap. An administrator will configure the types of events that constitute a trap (for example, a security breach, a power outage, etc.).
- We can manage all this data in a management information base, or MIB. The MIB has a hierarchy that spans all layers of the OSI model. The MIB identifies each stored variable with an object identifier or OID.
There are hundreds of different types of MIBs spanning all aspects of networks and devices. You must choose a MIB or set of MIBs that is right for your organization.
Devices also store data in logs
- A log is a record of different events generated by the device. For example, a switch may log each time it powers up, each time a port status changes to active, each time a user logs in, and each time it blocks traffic for security reasons
- A device may have one or multiple logs
- A device might store the logs on its internal storage or upload them to a server or cloud application
- An administrator may be able to determine what types of information is stored in the logs. A device may categorize issues by severity and then only log the most severe ones.
- When an incident takes place, we might obtain the logs from the affected devices and review them to determine the cause. It is important that the logs are backed up to a safe place if possible.
- A syslog is a tool that allows a device to send its logs to a central server. Each time an event occurs, syslog sends a message to the central server.
- We can use syslog in conjunction with SNMP. Why do we need both? SNMP messages use variables, which are predefined by the administrator. Syslog allows a system to send messages that are not predefined.
- If we have a device with custom applications (such as a web server or database), it will not be possible for an administrator to predefine all the possible variables that each of them would generate. Thus, we might use syslog. Any message generated by an application can be sent to the logging server.
- A syslog is a tool that allows a device to send its logs to a central server. Each time an event occurs, syslog sends a message to the central server.
- A traffic log keeps track of traffic entering and leaving the system
- An audit log keeps track of each user or administrator who logged into the system, when they logged in, and what changes they made.
Physically, the room where our network equipment is kept should have sensors for the following
- Temperature – the room should have a separate heating/cooling system if large enough. If the room is too hot, then equipment will overheat and likely get damaged or have a shorter lifespan. People will disagree on the ideal temperature. Many say that the most optimal temperature is 20-21°C (68-71°F). According to ASHRAE (American Society of Heating, Refrigerating and Air-Conditioning Engineers), the ideal temperature is 18°C-27°C (64.4°F-80.6°F).
It is better to run the room on the cooler side of the range rather than the hotter side. If the air conditioner were to fail, you would have more time to react. Running the room hotter will reduce energy costs.
Google runs its data centers at 26.7°C (80°F), but Google’s data centers are designed for optimal air flow and they use proprietary hardware that has been designed for the warmer temperatures. Your company probably does not have the same setup as Google. - Humidity – humidity is a measure of the amount of moisture in the air and should run between 40% and 60%. Too much humidity is bad because it will result in corrosion, which will lead to a shorter equipment life span. Too little humidity will create static electricity, which will also damage the equipment.
- Electrical – we should monitor the electrical consumption. Too much or too little consumption could indicate that equipment is malfunctioning.
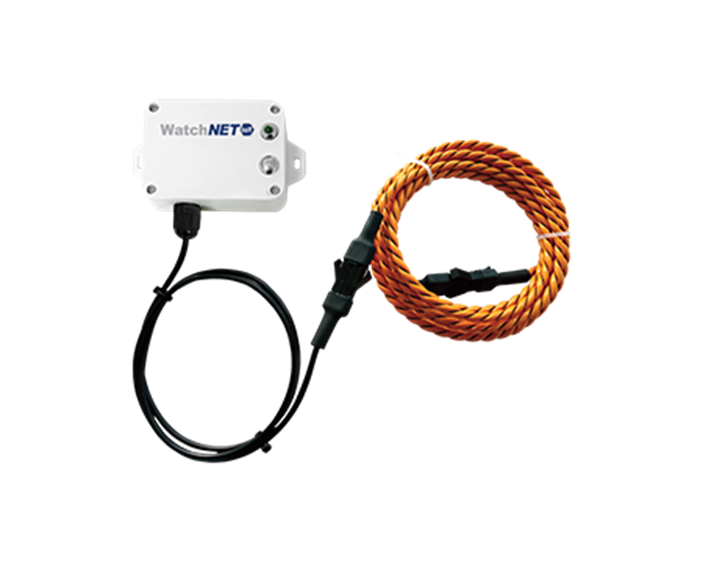
- Flooding – we must monitor the environment for flooding and react accordingly. A flood can come from an air conditioner condenser or from a leaky pipe or sprinkler. We can monitor flooding through a sensor. The most common sensor looks like a rope. It is placed on the floor and when it detects moisture it will send an alert to a control unit.
This system is only good for detecting floods that start at the ground level. There is not much we can do to prevent a water pipe in the ceiling from bursting and damaging equipment. Having said that, we should attempt to locate our server rooms away from sources of water.
The Baseline tells us how the network is performing on a regular basis. We can measure bandwidth, latency, jitter, and other factors. Once we have set a baseline (i.e. the expected performance of the network), we can compare the actual performance against it. If the actual performance is worse, we know that there is an issue with the network. We must always have something to compare the actual performance to.
We can also measure network performance with a tool called NetFlow. NetFlow is a feature in Cisco routers that measures traffic source, traffic destination, and protocols. We can use NetFlow to determine sources of congestion. NetFlow will show us how many different connections are present on our network and the amount of traffic generated by each one.
Uptime/Downtime.
- We can measure uptime as the amount of time that the network has been up consecutively. For example, if the network has been up for ten hours in a row, then we could say that the uptime is ten hours. If the network has been up for three months in a row, then we could say that the uptime is three hours. The uptime shows us how long it has been since the service has been interrupted.
- We can also express uptime as a percentage. For example, if our network uptime is 99.9%, then that means it only goes down for approximately 40 minutes per month. We might have a specific uptime percentage that we want to achieve.
- We can measure downtime the same way. If an incident takes the network down, we might want to measure how long the network is down.